Forums
Info
Community
Mapmaking
Events
Map Frequency, Growth Update, and Pie Charts, oh my!

Here's another statistics post! since thats all im good for nowadays</small>
Despite having the summer off as a sort of hiatus, most of the returning maps felt dry and overused within the first day of playing again. Now, I don't mean that as a call for action towards map developers nor an insult to those that organize the rotations; there's no point here, in fact -- simply data.
This time, instead of messing around with this hybrid Markdown formatting, it's all one neat little retro webpage:
https://stats.seth-phillips.com/reports/2019-08-29.htm
And if you'd rather the original Excel source, that's available too.
Enjoy.
~ [avatar:1e4cbacc-0fb5-445a-a99d-7c76f9d0b564] Siceth
P.S. - I have a question for everybody: what, to you, makes a map considered overplayed? Is it after seeing it x times OR after playing it x many minutes OR something else?


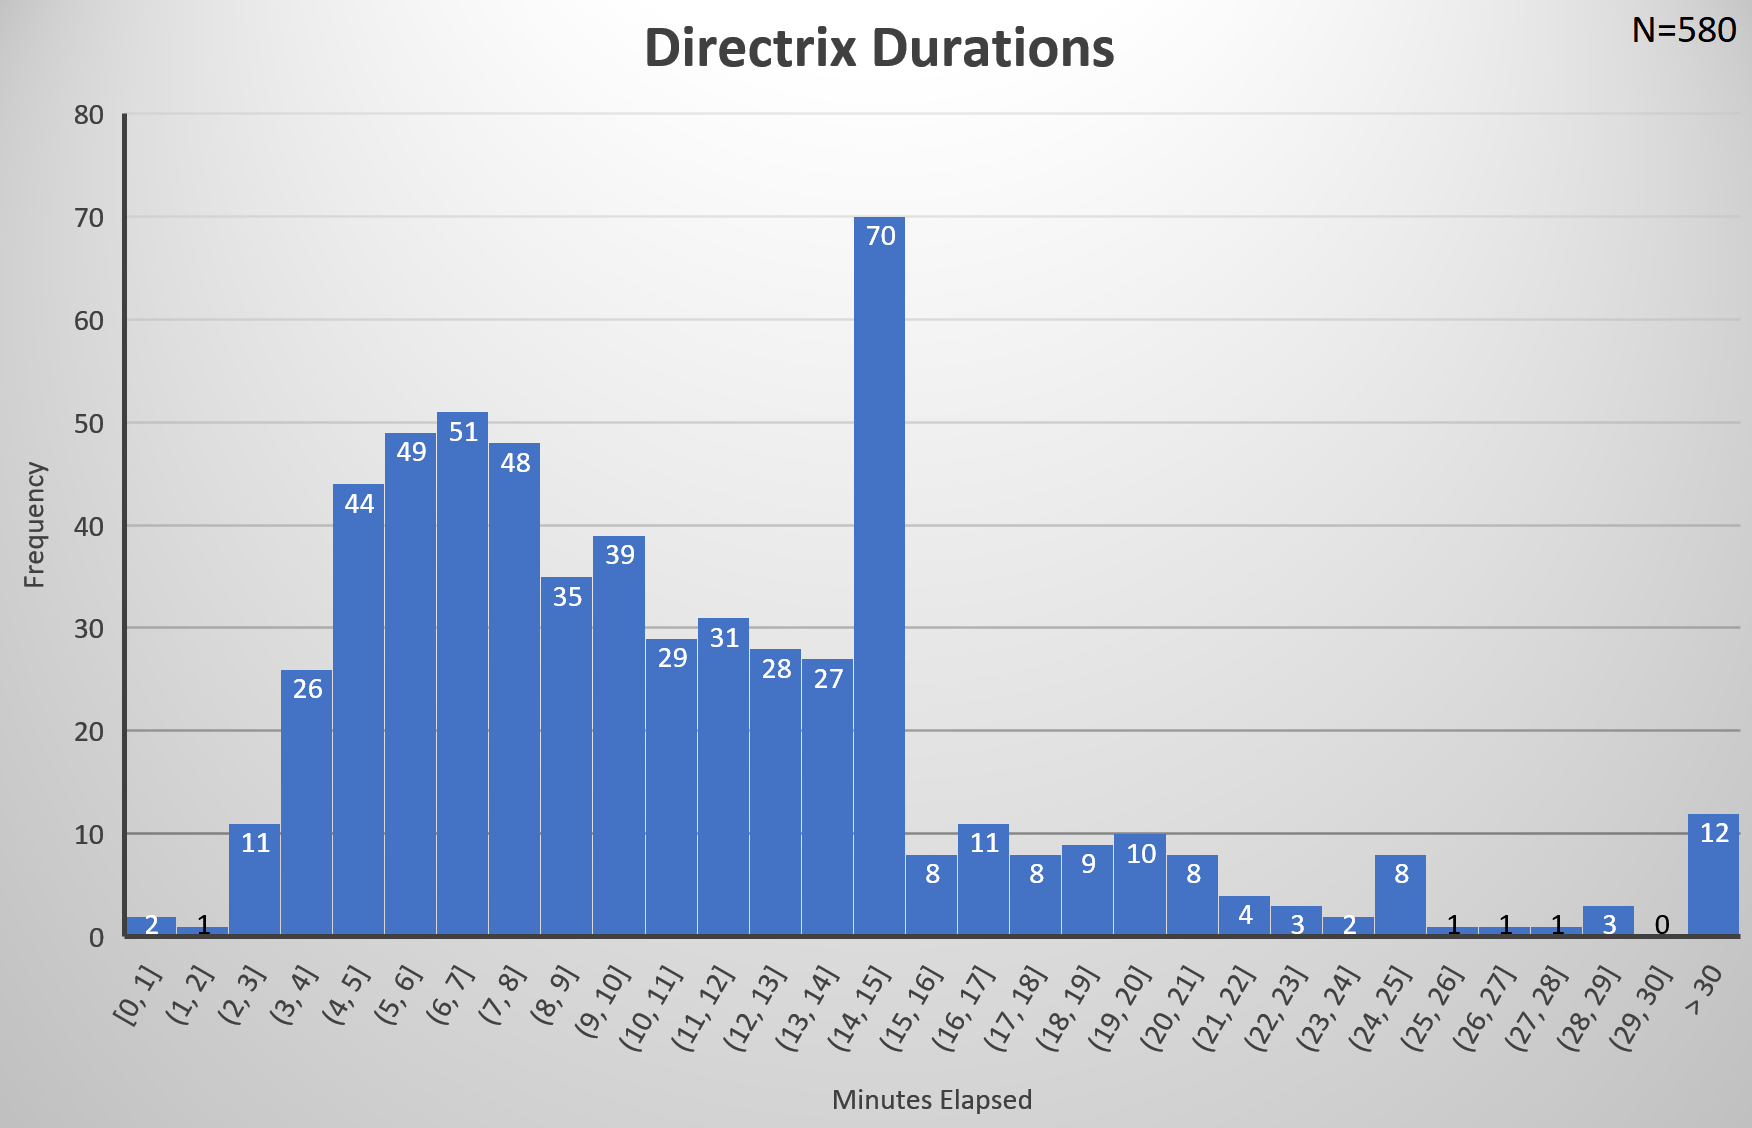
How does Directrix have such a large play time duration? Ranked 5th total with 105 hours... O.o
Great stats compilation, thanks!

Water Drop 0.1 days playtime
These numbers need to go up :)))

Yeye, always down to talk Directrix. Here's how the games have gone, keeping in mind it was possible to get +15 minute matches before 2019:
This data is correctly aligned with related findings a few months ago.
I would pin Directrix's large match count (and therefore total play time) on the fact that it's been in Mini and Medium rotations, which rotate much qucker.
Additionally, it should be noted that of the 400-some tokens I've purchased, there have been 166 successful polls, which accounts for 28.6% of the map's appearance.

I started bulk collect since 2018-07-22, but it's been possible to grab records from previous dates. The oldest match I have has a start timestamp of 2018-05-06 02:06:00, but most of the matches between May 6th and July 22nd are missing.
All in all, it's about 14 months worth.

It’d be fun to see map frequency by mapmaker.
Mine’s 250 I think

Log in to reply to this topic.